
Learn
Learn about shares by understanding and calculating
Start with shares and portfolios, or choose a topic you want to understand better. The library continues into trading, company statements, funds and valuation data. Lessons use concrete examples and questions to help you check the reasoning.

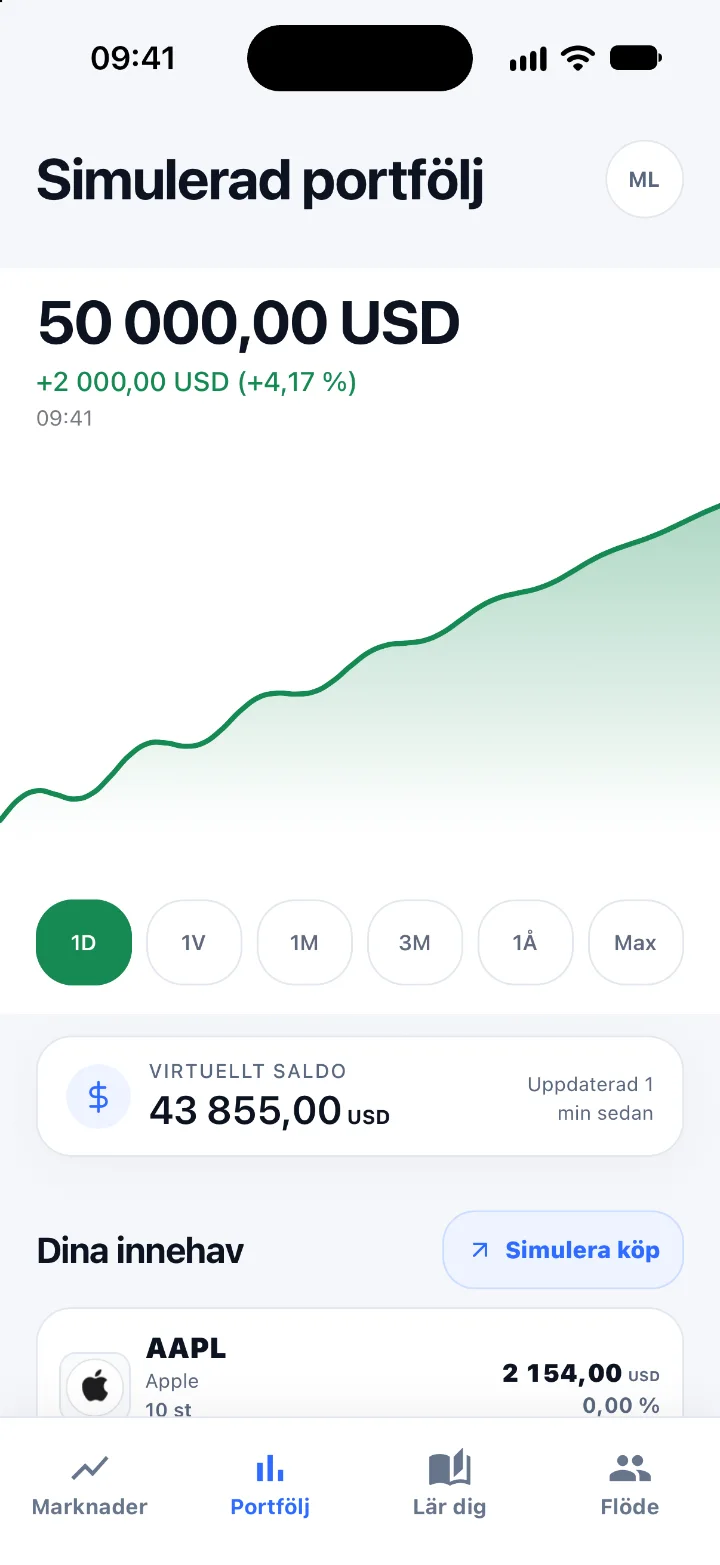

The exercises use invented amounts and work on paper without an app account. They are educational material and do not suggest which shares to buy.
Start here: shares and portfolios
Understand part ownership and practise holdings, allocation, diversification and simple percentage results.
- Concepts
What is a share? Ownership, value and a short quiz
Understand share ownership with a fictional bakery. Calculate a holding's value, try a short quiz and practise on paper without an app account.
- Concepts
What is a stock portfolio? Calculate holdings and value
Understand holdings and portfolio value with two fictional companies. Separate share counts from money and work through an account-value exercise.
- Calculations
Portfolio weights: calculate allocations and changes
Calculate a holding's weight as a share of total portfolio value. See why prices can change weights without a trade, then try your own example.
- Concepts
What is diversification? Compare two fictional portfolios
Understand concentration and diversification. Compare the same price drop in two allocations and see why several holdings cannot remove every risk.
- Calculations
Calculate percentage return: formula and practice examples
Calculate a simple change from starting value to ending value. Compare gains and losses in money and percent, and see why deposits need separate treatment.
- Calculations
Recovery after a price drop: calculate the required increase
Why does a 20 percent fall need a 25 percent rise to recover? Work through the formula, compare several declines and try a calculation yourself.
- Practice
A practice portfolio with virtual money: a learning plan
Practise investing without real money. Write an explanation, calculate a scenario and review your reasoning with a simple practice journal.
Prices, company events and currency
Separate share price from market cap, follow a split and check dividends, currency and chart periods.
- Concepts
Share price and market cap: why price does not show company size
Compare two invented companies with different share counts. Calculate market cap and see why a SEK 20 share can belong to the larger company.
- Concepts
What is a stock split? Calculate shares, price and ownership
Follow a fictional 4-for-1 split before and after. Calculate share count, holding value and ownership without treating more shares as a gain.
- Calculations
Calculate return including dividends: a simple example
Separate a price change from return including cash dividends. Calculate an invented holding and check why a dividend cannot be counted twice.
- Calculations
Percentages and percentage points: when a proportion changes
A portfolio weight moves from 20 to 25 percent. Calculate percentage points and relative change, then try an example with an explained answer.
- Calculations
Currency effects on stock returns: calculate price and exchange rate
A share rises in its own currency but loses value in SEK. Follow an invented conversion table and see why percentage-change factors are multiplied.
- Practice
Read a stock chart: time period, starting point and price basis
The same fictional price series gives different percentage results over different periods. Read the axes, check the price table and try a comparison.
Returns, inflation and company results
Compare nominal and real results, fees, annual averages and deposits. Also follow share issues and company sales.
- Calculations
Real return and inflation: calculate what your money can buy
An account grows by 5% while a fictional basket becomes 10% more expensive. Calculate purchasing power and try another example with a complete solution.
- Calculations
Fees and investment returns: account for the whole purchase and sale
A share price stays unchanged, but two fictional fee models give different results. Follow the payments, calculate the return and find the price that covers both fees.
- Calculations
Annualized return and averages: calculate two different measures
Two fictional two-year paths end at the same value but have different yearly results. Compare an arithmetic average with a compound annual return.
- Calculations
Deposits and investment returns: follow the money in the right order
Two fictional accounts face the same price change, but a deposit happens at different times. Follow the payment list and separate new money from investment gains.
- Concepts
New shares and ownership dilution: calculate the change in your stake
You retain 100 shares while a company’s total increases from 1,000 to 1,250. Calculate the stake, distinguish percentage points and compare a new issue with a split.
- Concepts
Revenue and profit: read a simple company result
Three fictional companies have different sales amounts, but the largest revenue does not produce the highest profit. Calculate results and margins and separate them from cash and share price.
Ratios and compound growth
Calculate EPS, P/E, dividend yield and payout ratio using clear denominators, and distinguish book value from market value.
- Calculations
Compound interest: follow a worked example year by year
Compare interest on the original amount with interest that stays in an account. Follow three fictional years, check the formula and solve a two-year exercise.
- Concepts
Earnings per share: calculate profit and the right share count
Two fictional companies have equal profit but different share counts. Calculate EPS, separate profit from dividends and try a weighted-average share count.
- Concepts
P/E ratio: calculate price in relation to earnings per share
Calculate P/E for three fictional companies. See how price and earnings change the ratio and why a low number alone does not establish a cheap share.
- Calculations
Dividend yield: calculate dividends in relation to price
The same fictional dividend produces different yields at two prices. Calculate the ratio and see why it does not describe the entire investment result.
- Concepts
Dividend payout ratio: compare dividends with earnings
Calculate a fictional company’s payout ratio using totals and per-share amounts. See how changing profit affects it and distinguish it from dividend yield.
- Concepts
Book value vs market cap: calculate the market value of equity
Book value is equity on the balance sheet: assets minus liabilities. Market cap is share price times shares outstanding, the market value of equity. Calculate both for a fictional company, then P/B.
Trading, risk and benchmarks
Read bid and ask prices, order conditions and liquidity. Compare volatility, drawdown and results against a chosen index.
- Calculations
Bid, ask and spread: follow the cash through a trade
Why do you buy at the ask and sell at the bid? Follow five fictional shares, calculate the spread and distinguish a position return from the whole account.
- Calculations
Market orders and limit orders: execution and price constraints
Calculate a purchase of ten shares across two price levels. Compare a market order with two buy limits and see why an order can fill only partly.
- Calculations
Stock liquidity: why quantity behind the quote matters
Two fictional stocks have identical best bids and asks but different order depth. Calculate the cost of ten shares and understand what low liquidity can mean.
- Calculations
Stock volatility: identical endpoints, different swings
Two fictional price series start at 100 and finish at 103 but take different paths. Calculate each period’s change and separate volatility from total return.
- Calculations
Maximum drawdown: calculate a fall from a previous peak
Follow a fictional value series that finishes positive but has a 25% maximum drawdown. See how prior peaks, chronological order and observation intervals affect the answer.
- Calculations
Compare a portfolio with an index: align the period and measure
Calculate a fictional portfolio against an invented index. Compare percentages rather than cash with index points, and check dividends, currency and the period.
Read company statements
Follow profit, cash flow and balance sheets. Calculate margins, equity ratios and working capital in bounded examples.
- Calculations
Cash flow and profit: follow an unpaid invoice through two months
Can a business show a profit while its cash falls? Follow a fictional invoice through two months and calculate profit, the receivable and actual cash flow.
- Calculations
Read a balance sheet: what changes after a loan and an equipment purchase?
Follow a fictional balance sheet before a loan and an equipment purchase. Check that assets equal liabilities plus equity after each event.
- Calculations
Gross margin and markup: the same money, different percentages
An item costs SEK 60 and sells for SEK 100. Calculate gross margin and markup with different denominators, and see why a 25% markup gives a 20% margin.
- Calculations
Operating margin: follow SEK 100,000 from revenue to operating profit
Calculate operating profit and operating margin in a fictional income statement. Distinguish a 15% operating margin from a 9.6% net margin.
- Calculations
Equity ratio: why a new loan can lower the percentage without reducing equity
Calculate an equity ratio in a simplified balance sheet. Follow a new loan, separate amounts from percentages, and check the meaning of adjusted equity.
- Calculations
Working capital: a positive amount is not the same as cash in the bank
Calculate current assets minus current liabilities. Follow customer and supplier payments that change cash while leaving working capital unchanged.
Funds, bonds and ownership
Distinguish shares from fund units and bonds. Explore index funds, ETF quotes, voting rights and new or existing IPO shares.
- Concepts
Shares and fund units: distinguish company ownership from a fund holding
Follow two fictional companies inside a small fund. Calculate a fund unit’s value and compare it with direct shares without assuming every fund has the same risk.
- Concepts
What is an index fund? Separate the fund from the index it tracks
An index is a calculated benchmark; an index fund has assets and costs. Calculate a fictional two-company index and follow one fund model’s difference from it.
- Concepts
What is an ETF? Market price and fund value in a worked example
An ETF is an exchange-traded fund. Follow fictional bid and ask prices, compare a simultaneous NAV, and separate trading format from investment strategy.
- Concepts
Shares and corporate bonds: company ownership versus a debt claim
Compare a share with a fictional corporate bond. Calculate coupon rate and coupon relative to price without treating a payment obligation as guaranteed cash.
- Concepts
A and B share classes: calculate ownership and voting percentages separately
Two fictional share classes have different votes but equal economic rights per share in the model. Calculate quantities and votes without assuming letters mean the same everywhere.
- Concepts
Listings and IPOs: new shares, existing shares and who receives the money
Follow a fictional offering with new shares and selling shareholders. Separate new company capital from proceeds to an existing owner and a later market price.
Analyse company finances
Examine growth, net debt, liquidity, free cash flow, ROE and inventory turnover with the right period and capital base.
- Calculations
Revenue growth: calculate percentages and segment weights
Calculate sales growth for an invented company with two segments. Check comparison periods, starting weights and why higher revenue does not establish higher profit.
- Calculations
Company net debt: a worked example with cash and loans
Sort interest-bearing loans and other liabilities in a fictional company. Calculate net debt, test borrowing and repayment, and distinguish net cash from having no liabilities.
- Calculations
Current ratio and quick ratio: compare two liquidity measures
Calculate two liquidity ratios at one fictional balance-sheet date. See how inventory creates the difference and how a sale or payment changes numerators and denominators.
- Calculations
Free cash flow: reconcile investments and actual cash changes
Calculate a stated free-cash-flow definition for a fictional company. Reconcile capital spending, asset sales and financing with the actual change in cash.
- Calculations
Return on equity, ROE: calculate using average equity
Calculate a fictional company’s ROE using annual profit and average equity. Compare beginning and ending bases and distinguish company ROE from shareholder return.
- Calculations
Inventory turnover: calculate turns and inventory days
Use cost of sales and average inventory for a fictional full year. Distinguish turnover from sales revenue and test a separate six-month period.
Check stock data and valuation
Identify instruments, separate trading volume from revenue and test EV, P/S, buybacks and period-weighted shares.
- Concepts
Ticker and ISIN: separate the instrument from its trading venue
Compare three fictional instrument cards. Distinguish ticker from ISIN and check share class, venue, currency and observation time before comparing quoted prices.
- Calculations
Trading volume, traded value and company revenue: follow three share trades
Calculate share volume, traded value and weighted average price from three fictional executions. Separate market trading from the company’s customer sales and avoid double counting.
- Calculations
Enterprise value: build the bridge from equity value, debt and cash
Calculate a simplified enterprise value from market capitalisation, debt and cash. Try new borrowing and a different share price, then separate the capital measure from a quoted share price.
- Calculations
Price-to-sales ratio: calculate the multiple and check profit separately
Compare two fictional companies using market capitalisation, revenue and margin. See why a lower P/S multiple alone proves neither better profitability nor lower risk.
- Calculations
Share buybacks: follow cash, remaining shares and earnings per share
A simplified repurchase shows how fewer shares can raise EPS without higher total profit. Calculate cost and ownership, and identify why the later share price remains unknown.
- Calculations
Weighted average shares outstanding: formula and EPS example
To get weighted average shares outstanding, multiply each share count by the part of the period it applied, then add. Follow a fictional 180-day timeline and calculate EPS.
Want to work together?
Try the 45-minute classroom activity with shared assumptions, sources and discussion questions.
You can also explore classroom worksheets with teacher notes, or family and friend activities.
Practice now. Invest later.
Investiq is live

Free · For iPhone · Now on the App Store